
Mobile Performance
In 2016 our team was releasing a mobile ecommerce web app, and my development team was assigned to help with performance optimization. During this process, I learned a great deal about metrics, optimization, and how difficult it can be to deliver a mobile experience that performs. Our CIO had quite confidently communicated to our stakeholders that our new platform would deliver pages in less than one second. Although the threshold seemed to be a bit of internal marketing, and everyone had assumed this time came with caveats, (aggressive caching, low network latency, etc.) it would still be a challenging target to hit.
Google Lighthouse Audit Tool
In 2016, I think Google Lighthouse was still a browser extension, but since then it has been integrated into Chrome Developer tools. While Lighthouse is based on a simulated device using a throttled network and CPU slowdown, it still seems like the most practical way to check a mobile site for performance best practices, and provides a reasonable approximation of real world load times. Additionally, Lighthouse provides scores on Accessibility, Best Practices, SEO, while providing a checklist for PWA optimization.
While looking into the performance of our team's mobile site, I believe we consistently scored in the 40-50 range on performance measure within Lighthouse. Without context, this seemed like a terrible measure, especially since we had already corrected many of the low-hanging issues. I decided to do some research on other mobile commerce sites just to see where we compared, and I was pretty surprised by how poor some of the major players were scoring.
Popular Mobile Site Scores
Fast-forward four years, and I thought there would be a considerable improvement in the performance scores given the rising share of mobile transactions. For the most part, I was wrong.
A few points about the results below:
- Scores were taken February 8-9, 2020
- Sites were selected semi-randomly (this seemed like a good cross section from the US)
- Are from one test audit (I did not run multiple audits)
- Capture the site home page
- Audit Settings:
- Mobile Device
- Simulated Slow 4G, 4x CPU Slowdown
- Storage Cleared
For more information on how to read the scores, visit:
👉 Lighthouse Scoring Guide
👉 Lighthouse Score Weighting
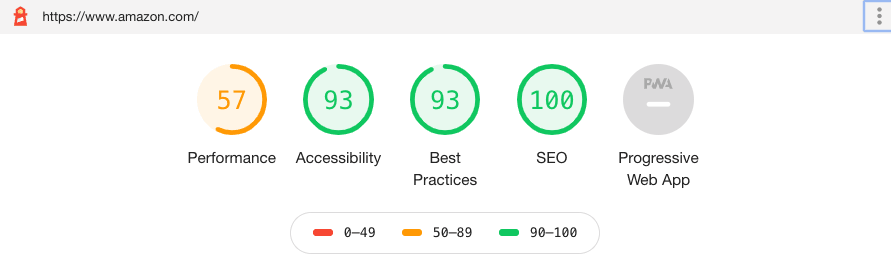

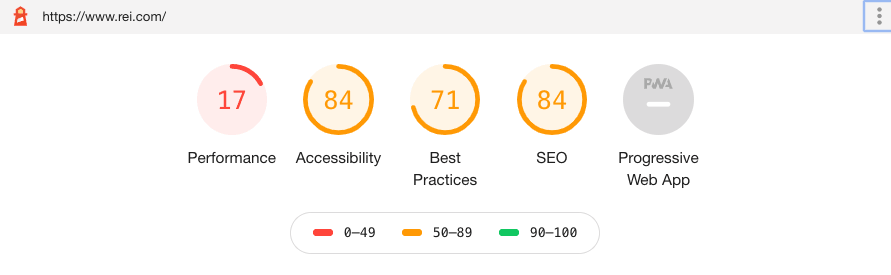
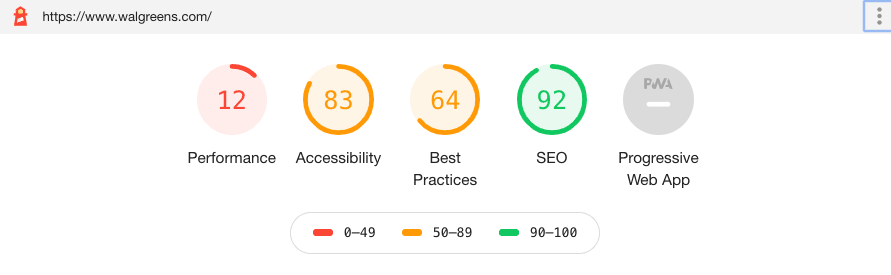

First Contentful Paint, Speed Index, and Time to Interactive are performance score weighted 20%, 27%, 33% respectively. Here are the values:
| FCP | SI | TTI | Size | |
|---|---|---|---|---|
| amazon | 2.7s | 4.1s | 9.3s | 4.6 Mb |
| walmart | 3.9s | 7.4s | 17.1s | 1.5 Mb |
| rei | 3.9s | 9.0s | 22.0s | 2.6 Mb |
| walgreens | 4.3s | 12.6s | 25.5s | 2.3 Mb |
| home depot | 3.8s | 11.6s | 28.0s | 6.2 Mb |
| FCP = First Content Paint SI = Speed Index TTI= Time to Interactive |
What is Going On?
So why are most of these sites performing so poorly? Do they not have teams of engineers dealing with performance and optimization? At the very least, would these scores not catch the attention of some executives who understand the relationship between performance, user experience, and lost revenue potential?
According to a 2017 report from Akamai:
- A two-second delay in web page load time increase bounce rates by 103 percent
- A 100-millisecond delay in website load time can hurt conversion rates by 7 percent
- 53 percent of mobile site visitors will leave a page that takes longer than three seconds to load
Obviously, we can't know what goes on in these organizations or what decisions may have led to a poorly performing mobile experience, but my guess is that one or more of the following apply:
- Leadership (Business, IT, or UX) are unaware of the problem
- Site performance is measured and benchmarked, but mobile web is not properly factored into this metric
- Mobile web experience is only measured in terms of a responsive layout, without performance considerations
- Mobile investments are primarily routed to native app development & support
Chinese Commerce Sites
I thought it might be interesting to look at popular ecommerce sites from China to contrast how they handle mobile web performance. By all accounts, US consumers movement to mobile commerce lags behind China in which mobile commerce make 60%-80% of total ecommerce transactions depending on research sources. In any case, mobile web performance of China's top ecommerce sites suggest a much more mobile-focused strategy:

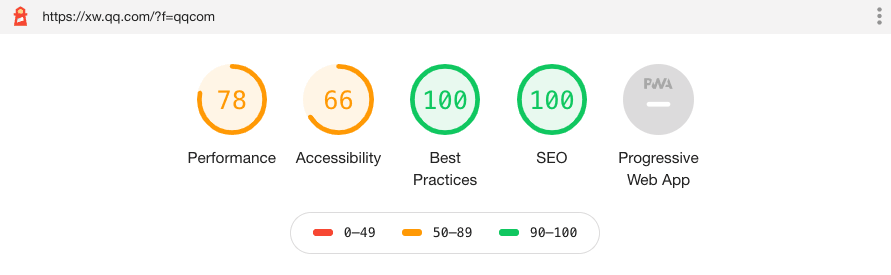


| FCP | SI | TTI | Size | |
|---|---|---|---|---|
| pinduoduo | 3.0s | 4.2s | 3.5s | 2.5 Mb |
| 3.5s | 3.5s | 4.6s | 444 Kb | |
| tmall | 3.3s | 4.2s | 5.5s | 600 Kb |
| taobao | 2.6s | 3.3s | 7.1s | 1.1 Mb |
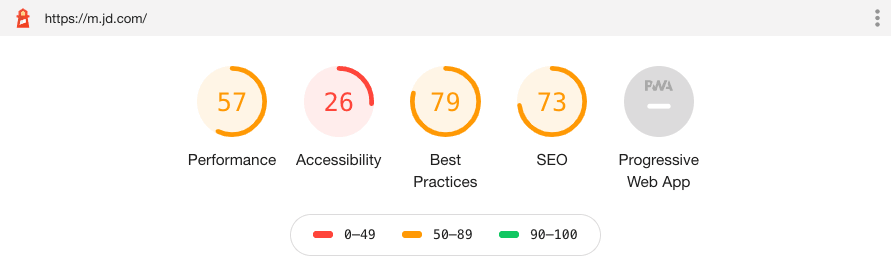
| jd | 2.7s | 6.1s | 8.0s | 1.2 Mb |
| FCP = First Content Paint SI = Speed Index TTI= Time to Interactive |
While the US sites contain some degree of dynamic server–side sourcing and/or responsive design elements all routed through the same web address, the Chinese sites (with the exception of tmall which uses the same domain but dynamically serves different documents) use a mobile-only web address, in which the designs never respond to any viewports larger than what could be viewed on a mobile phone. The page weights and TTI are strikingly better that what we saw from the US counterparts - the worst performing Chinese site (m.jd.com) matching the best performing US site (amazon.com) in terms of Lighthouse audits.
The Chinese sites average just over 1 Mb of page weight while the US sites average a little over 3 Mb. When it comes to TTI, the gap widens - 5.74s versus 20.38s.
We've remade the Internet in our own image, which, in the United States, is obese.
- Jason Grigsby
As US mobile transactions catch up with China, I'm hopeful we will we see more emphasis on mobile performance metrics. My intuition is that this is largely a problem of awareness - without support from the UX community or some other performance "champion" in these organizations, metrics such as these often remain an afterthought. Since Google has been using page speed as a factor in their mobile rankings, it would reason that SEO teams would be strong advocates for performance optimization. As UX practitioners, we can and should advocate for a better experience through more performant web sites, however, drawing a strong correlation to bottom-line revenue figures can often provide more tangible motivations for decision makers.